Load testing is one of the many types of testing Software Quality Assurance Engineers employ to check whether the system works according to expectation.
Load testing is done to determine the system performance under the expected workload. For example: 100 users are trying to login to the system simultaneously. With load testing, we determine whether the system will perform efficiently under this load. We evaluate system performance under different metrics such as response time, throughput, scalability, resource utilization etc of the system.
QAs frequently use tools such as JMeter, LoadRunner, Gatling, WebLOAD for load testing. In this blog, I will focus on my experience with load testing using Apache JMeter. Apache JMeter is the most widely used load testing tool, as it is user friendly, open-source and easy to use.
Installing JMeter
Before downloading and installing JMeter, ensure Java is installed in the system.
Download the zip folder of JMeter from the Apache JMeter website and extract the zip folder. Then go to the bin folder as it contains the JMeter script file for starting JMeter.

JMeter can be launched in two modes: GUI and Non-GUI mode.
GUI mode is useful for adding and editing new configuration elements, thread groups and samplers and listeners for viewing results and debugging. However, GUI mode slows down the CPU utilization while running the recorded script, which is its only limitation.
Open In GUI Mode
ApacheJmeter»bin» select the jmeter.bat file.

Then the JMeter window will open on the screen.

How do we give load to the system?
The load is given to the system by creating virtual users, known as threads. The number of threads in the thread group represents the load in the system. To create threads in JMeter, Open Jmeter in GUI mode and right-click on the test plan. Select “Add>Threads>Thread group”. Configure the thread group by increasing the number of threads, ramp-up time and loop count as per the requirements.


To send requests to the system being tested, Samplers are added by right-clicking on the thread group and selecting “Add>Sampler”. The type of sampler is selected as per need, such as an HTTP request sampler.

The sampler is configured by setting the protocol, server name, port, path and other parameters required for the application to be tested.

In most cases, the application being tested may require specific HTTP headers to be present in the request, such as an authentication token, content types, user agents etc., to ensure that the requests are properly authenticated and accepted by the server. So, The Header Manager is added to the Sampler to send the additional HTTP headers with our requests.
To add Header Manager, Right click on the sampler and select “Add>Config Element>HTTP Header Manager”

Configure the header manager by adding the authentication token, content-type and other elements and hit the save button. The token is either given on the documentation or obtained by logging in to the URL in Postman.

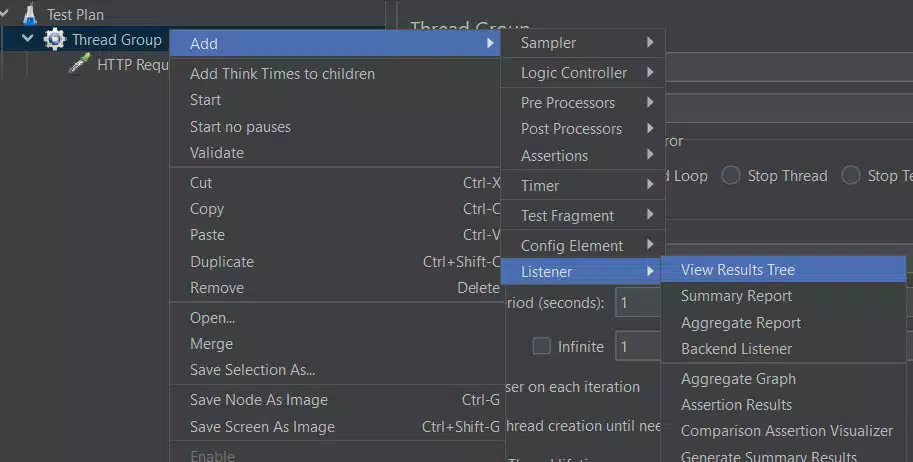
Finally, to view the test results add listeners by right clicking on the thread group and selecting “Add>Listener”. We can select as many listeners as we want, such as View results tree, summary report, aggregate report aggregate graph etc.

Once the thread group is configured, samplers and listeners are added, the test is run, and the load is generated on the system. JMeter collects data about the performance of the system under load.
The results of the test run can be viewed using different types of listeners for different numbers of threads. The results can be analyzed by checking the various metrics such as response time, throughput, error rate and other performance indicators.


The summary results can also be saved in the CSV format by clicking the “Save the table data”.

However, the summary results can also be obtained using the CLI mode of the JMeter. To use the CLI mode the command is:
jmeter -n -t [location of your Jmeter test file] -l [ location of your results file]
Where,
-n = non-gui mode
-t = location of the jmeter script
-l = location of the test file
For eg:

Findings from this test show that if 20 users simultaneously access the admin portal of this application : the average response time is 8898ms, throughput is 1.8/sec with a 0% error rate.
It means the site’s performance is good under the given load. In case the performance doesn’t meet expectations, we can take necessary steps to optimize its performance.
Conclusion
After load testing, we generally identify the performance bottlenecks from the report generated and take appropriate action to improve the application’s performance.
We can optimize the results by changing the ramp-up time for the number of threads per sec or optimizing the network issues. Similarly, if we find the error rate is high, we can investigate the root cause of the errors and fix the underlying issues.
.……
Gurzu is a software development company passionate about building software that solve real-life problems. Explore some of our awesome projects in our success stories.
Need help with automating your software tests? Gurzu engineers can help you! Drop us a message.
Have a tech idea that you need help turning into reality? Book a free consulting session with us!